Trial Balance, general ledger, company P&L, Balance sheets, Rankings, Management Income Statements, Transactional journal, Tax & Chart of Accounts
The reporting options in General Ledger are extensive with many formatting options available for each. Please review each reporting window and generate each report with different options where applicable. The following is a synopsis of each report and its purpose.
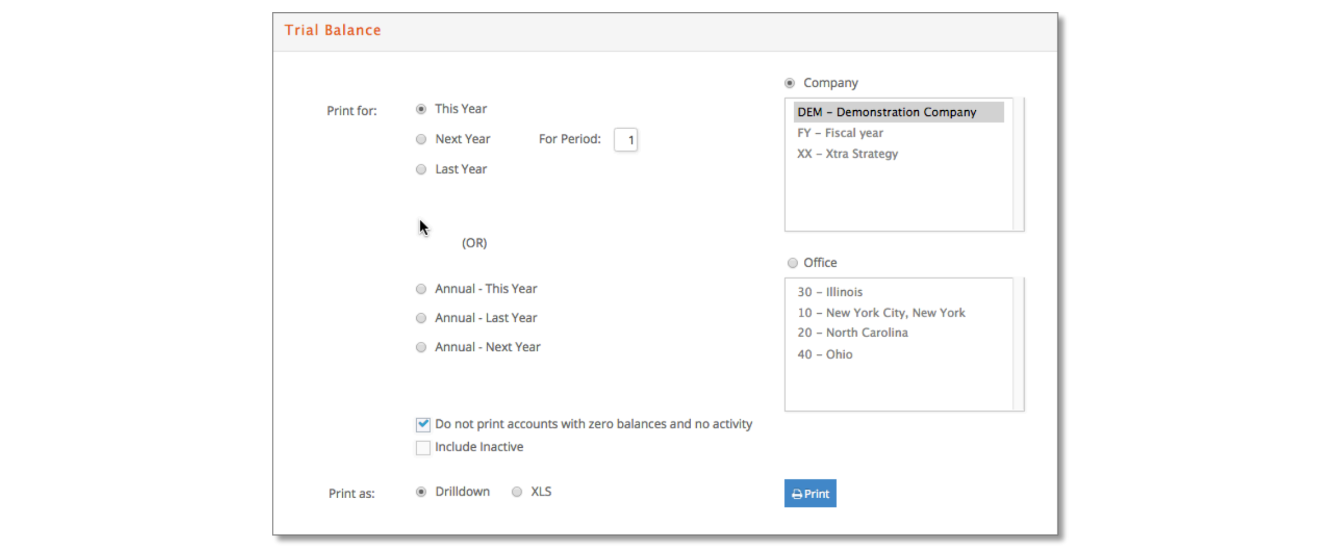
Trial Balance
Lists the opening and closing balances along with the total debits and credits for each account.
- Print for a selected fiscal period or annual fiscal year for This Year, Next Year or Last Year.
- Print by Company or Office.
- Print to view as a Drilldown by default or download to Excel as XLS.
- Check the "Do not print amounts with zero balances and no activity” if you do not wish to have accounts with zero balances included in the trial balance.
- You also can choose to include accounts that are currently set as inactive. Check this option if any inactive accounts may have activity for the selected period(s).
When the report is presented:
- Click the GL Account to view the general ledger for that account.
- Click the JE# to view the journal entry in detail.
- Lastly, if the reference is displayed in blue, click and you can view the source transaction.
- Reprint with the “Include Inactive” accounts option if the report appears out-of-balance.
General Ledger
Lists, for each account, the opening and closing balances and the details of all transactions posted to each account for the time period selected.
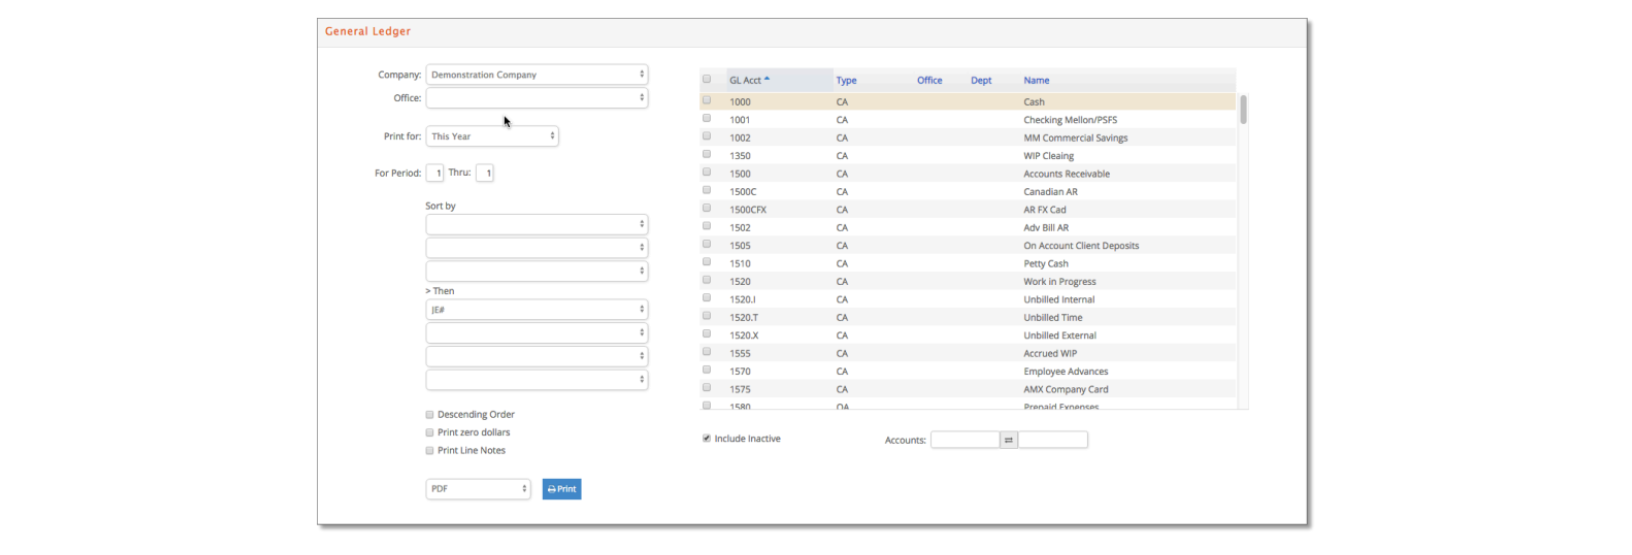
You have several options in this window including:
- Select to print for a range of fiscal periods for This Year, Next Year or Last Year.
- Select all accounts, click some accounts or enter a range of accounts at the bottom of the window.
- By default, all accounts with activity will print, however, you can also print for selected accounts by checking the box to the left of each account number.
- Optionally select to override the default sorting by GL Account to sort first by company, department or office instead.
- Then subsort by JE#, JE type, posting period or date with the option to print in ‘Descending Order’.
- Check to optionally include zero dollars or line notes from manual JEs or vendor invoice GL distributions.
Balance Sheet
Lists current balances of the asset, liability, and equity accounts for the fiscal period or year selected. The balance sheet can also be presented with a prior year comparison, including variances and percentages or in summary account format.
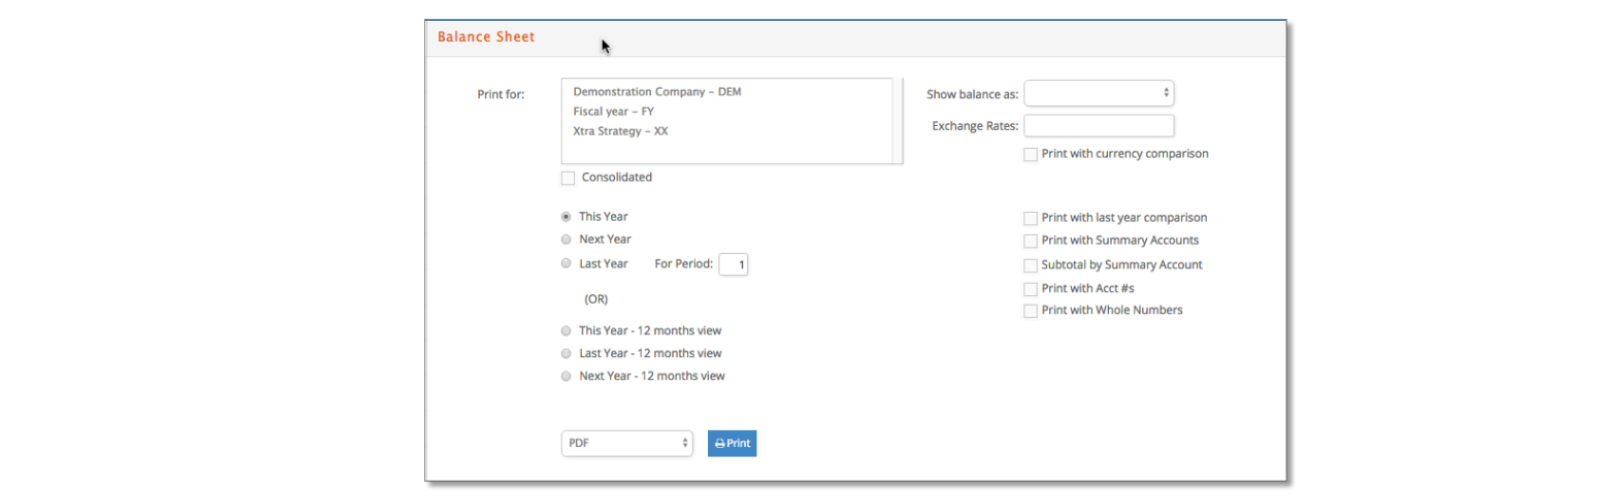
Let’s review the formatting options available to you:
- Select to print for This Year, Next Year or Last Year.
- If you are a multi-company database, you can generate a consolidated Balance Sheet by selecting two or more companies in your list and clicking the Consolidated checkbox.
- If you are a multi-currency entity and one company’s General Ledger is maintained in a different currency, e·silentpartner can convert the Balance Sheet to your preferred currency by selecting a currency from the ‘show balance as’ and entering the exchange rate that should be applied.
- You can print or subtotal by summary accounts – review the description of summary accounts in the GL Setup section.
- You can print the Balance Sheet with a comparison to the same period of the prior year.
- Lastly, you can print the Balance Sheet with whole numbers and/or show the GL Acct #s.
Company P&L
Regular (Profit & Loss)
Lists Monthly and Year to Date activity for the revenue and expense accounts for the time period selected.
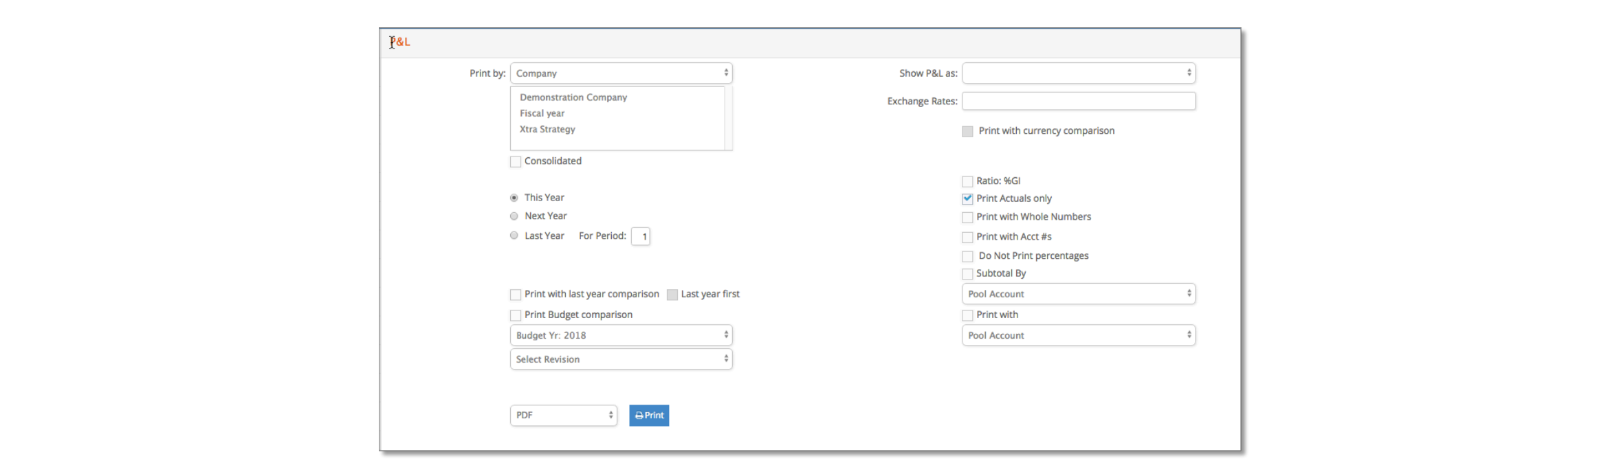
Let’s review the formatting options available to you:
- You can print the P&L by company, department or office.
- Select to print for This Year, Next Year or Last Year.
- If you are a multi-company database, you can generate a consolidated P&L by selecting two or more companies in your list and clicking the Consolidated checkbox.
- If you are a multi-currency entity and one company’s General Ledger is maintained in a different currency, e·silentpartner can convert the P&L to your preferred currency by selecting a currency from the ‘show P&L as’ and entering the exchange rate that should be applied.
- You can print or subtotal by summary or pool accounts – review the description of summary and pool accounts under the GL Setup section.
- You can print the P&L with a comparison to the same period of the prior year.
- You can print the P&L with comparison to the operating budget.
- Lastly, you can print the P&L with whole numbers and/or show the GL Acct#s.
Comparative (Profit & Loss)
A different view of your P&L with the capability to compare different fiscal periods in the same report.
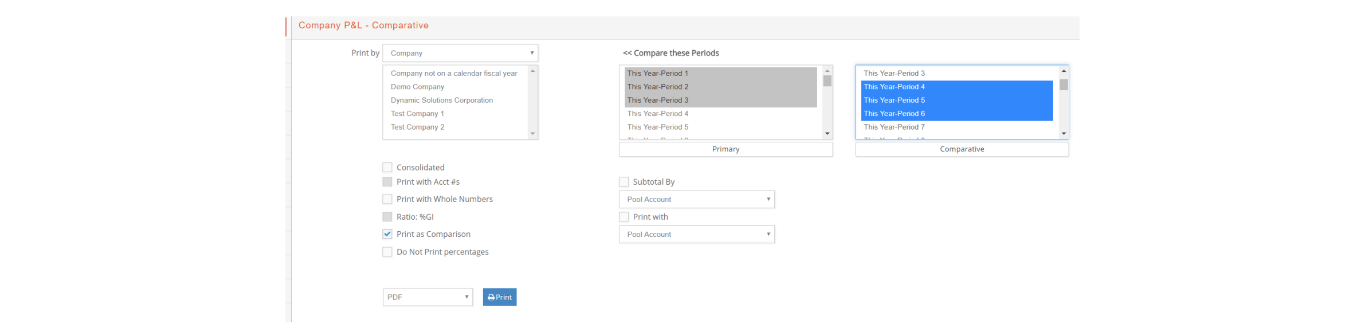
Let’s review the formatting options available to you:
- You can print the P&L by company, department or office.
- Highlight the Primary & Comparative periods to compare within This Year, Next Year or Last Year.
- If you are a multi-company database, you can generate a consolidated P&L by selecting two or more companies in your list and clicking the Consolidated checkbox.
- You can print or subtotal by summary or pool accounts – review the description of summary and pool accounts under the GL Setup section.
- You can ‘Print as Comparison’ by default to show the variance amount with %.
- Otherwise, you can select to print with the ‘Ratio:%GI’ option to show the % of sales.
- You can select to not print any percentages.
- Lastly, you can print the P&L with whole numbers and/or show the GL Acct#s.
Annual (Profit & Loss)
An annual P&L report recapping the fiscal year for This Year, Next Year or Last Year on a period-by-period basis. It lists the net monthly activity for all accounts in the general ledger for each fiscal period. Furthermore, it’s useful in analyzing revenue and expenses for budgeting purposes.
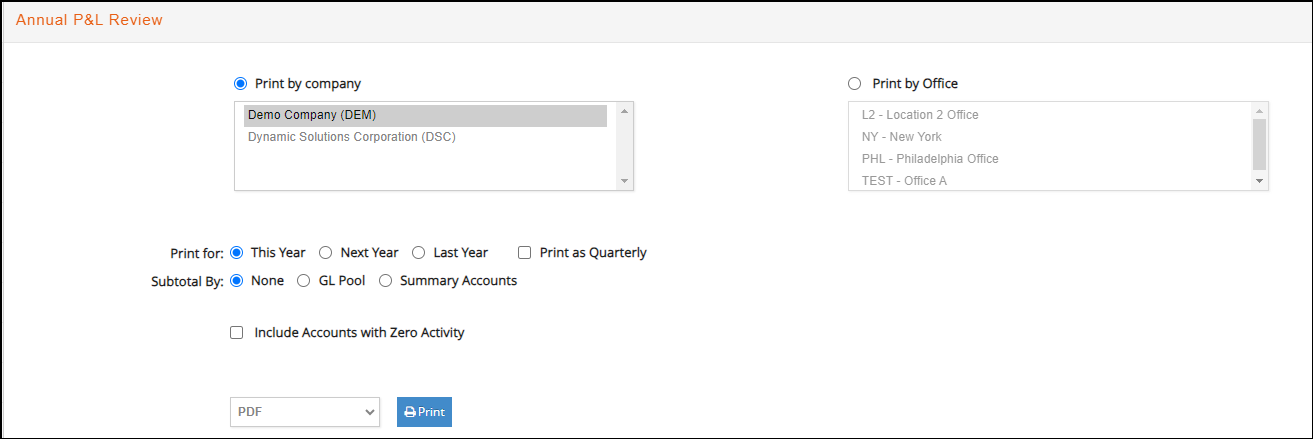
- Print for one or more by companies or offices.
- Print for This year, Next Year or Last Year (with option to print by year/month -defaulted- or year/quarter
- Optionally subtotal by GL Pool or Summary Account
- Optionally include accounts with zero activity.
Rankings
This report presents a summary of how your clients or Accounts Executive rank over two comparative fiscal periods.
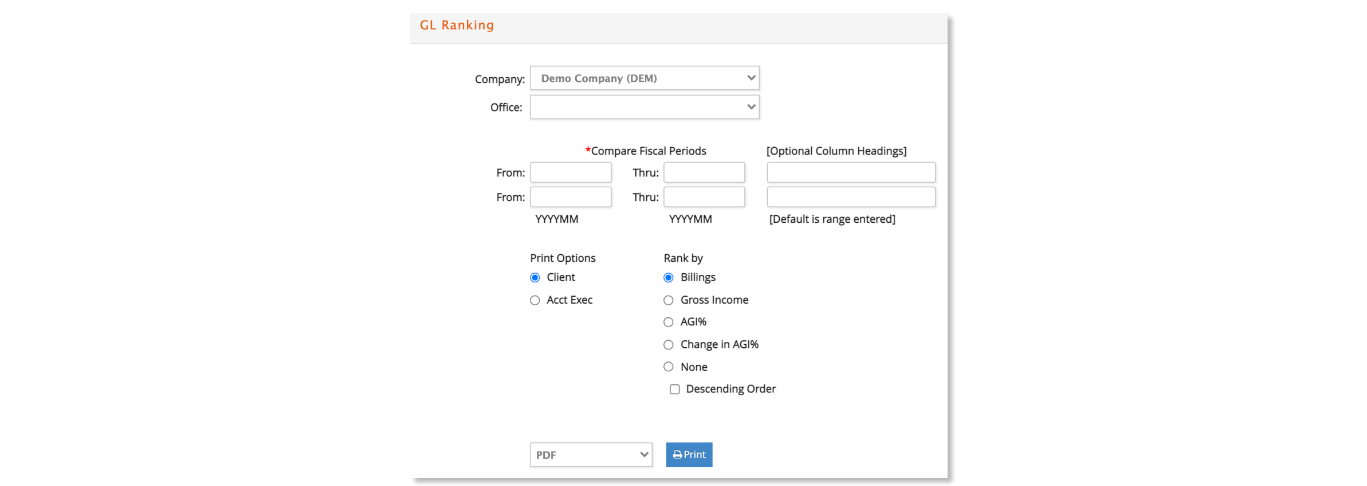
- Specify the TWO period ranges to compare with optional column headers.
- Rank by billings, gross income, adjusted gross income %, change in adjusted gross income % or none (none lists alphabetically).
- Optionally select to rank the list in descending order.
Management Income Statements
Management Income Statements are similar to the company P&L except much of the data comes from job transactions such as client invoices, non-billable AP charges, time charges or write-offs from AP charges or media. Additionally, some data may come from journal entries for manual JEs, AR discounts or media order write-offs where appropriate.
Let’s review each column and discuss the source of the numbers displayed.
- Revenue: Derived from the amount billed or any manual journal entries posted to revenue accounts with a client entity. Revenue could also include any discounts or write-offs applied to a revenue account when entering client payments. Additionally, if you use earned but unbilled revenue processing, the Revenue includes any revenue recognized from the job charges.
- Net: Derived from the cost billed or any manual journal entries posted to direct expense accounts with a client entity. Additionally, if you use earned but unbilled revenue processing, the Net includes any direct expenses recognized from the job charges. Lastly, Net also includes: external costs written off for production or media; external costs that were applied against a job and classified as NOBILL and any discounts or write-offs applied to a cost of sale account when entering client payments.
- Gross Income: Revenue – Net.
- Labor: Derived from the cost on time charges entered by your employees. Note: There is an option to import payroll costs which calculates a payroll related cost for each time charge.
- Overhead: When the report is generated, e·silentpartner determines the overhead for the fiscal period and YTD selected. Total labor cost (derived from time charges posted to billable or non-billable jobs excluding internal jobs) is subtracted from the overhead to determine the remaining overhead to be allocated. Thus, the remaining overhead is pro-rated back to the client (or any other reporting entity selected) based on the overhead allocation option selected by labor costs or labor hours. Depending on the format additional allocations by GL Accounts, % of Revenue or % of Gross Income may be available.
These reports, available as Detail, Summary, Annual Mgmt Review or Analysis YTD, enable you to run the Management Income Statements in countless combinations such as:
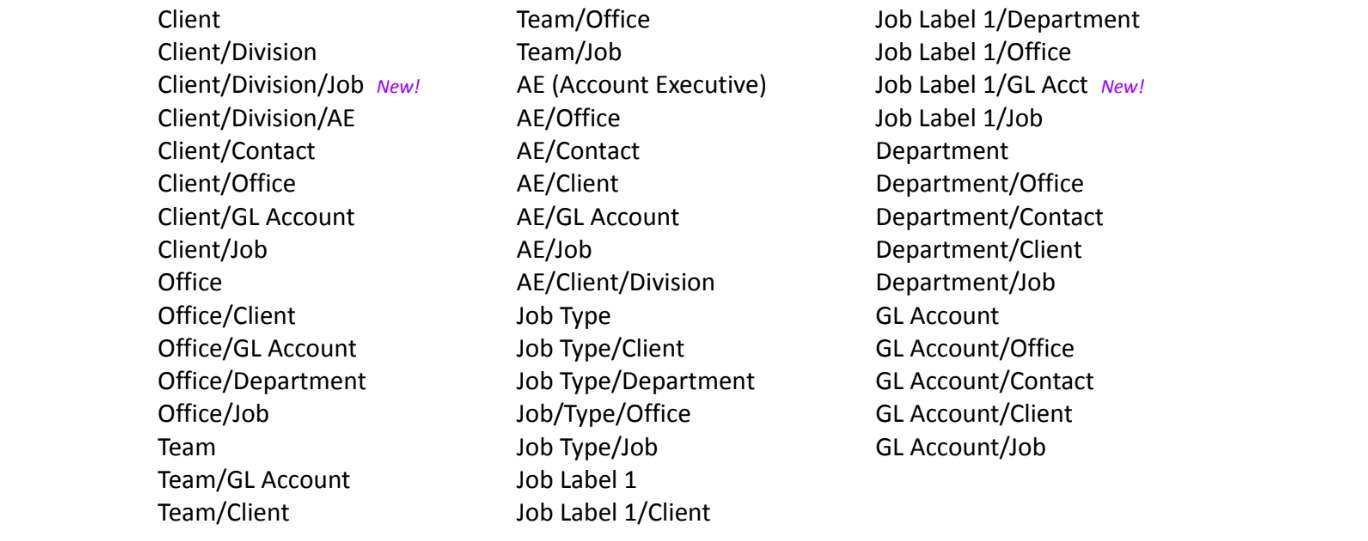
Depending on the report generated, the Print Options include:
- Print for all by default or select the specific codes to include in the report. The selection list value boxes show active values first followed by any starred inactive values.
- Select the ‘Overhead Allocation’ to report based on labor costs, labor hours, GL accounts (available for the Office or Department formats only) or % of Revenue or Gross Income (available for the Summary (Landscape formats only).
- Check or uncheck whether to ‘Show YTD’ on the Detail or Summary Reports.
- Use the ‘Payroll Labor Costs’ option to report labor using payroll costs that were imported instead of the standard employee costs. Review the GL > Import JE > Payroll Cost section of this guide for more detailed information.
Detail (Portrait)
This reporting window prints the Mgmt Income Statements as a separate P&L report for each selection by client, client/division, client/contact or client/office. Each P&L details Revenue and Cost of Sales (Direct Expenses) by GL account with labor details by department.
An option to ‘Show Non-billable costs below gross income’ will separate nobill or write-off charges from cost of sales into a distinct Non-billable Costs section below the Gross Income subtotal. Non-billable costs include any non-billable AP charges and write-offs from AP job charges or media supplier invoices.
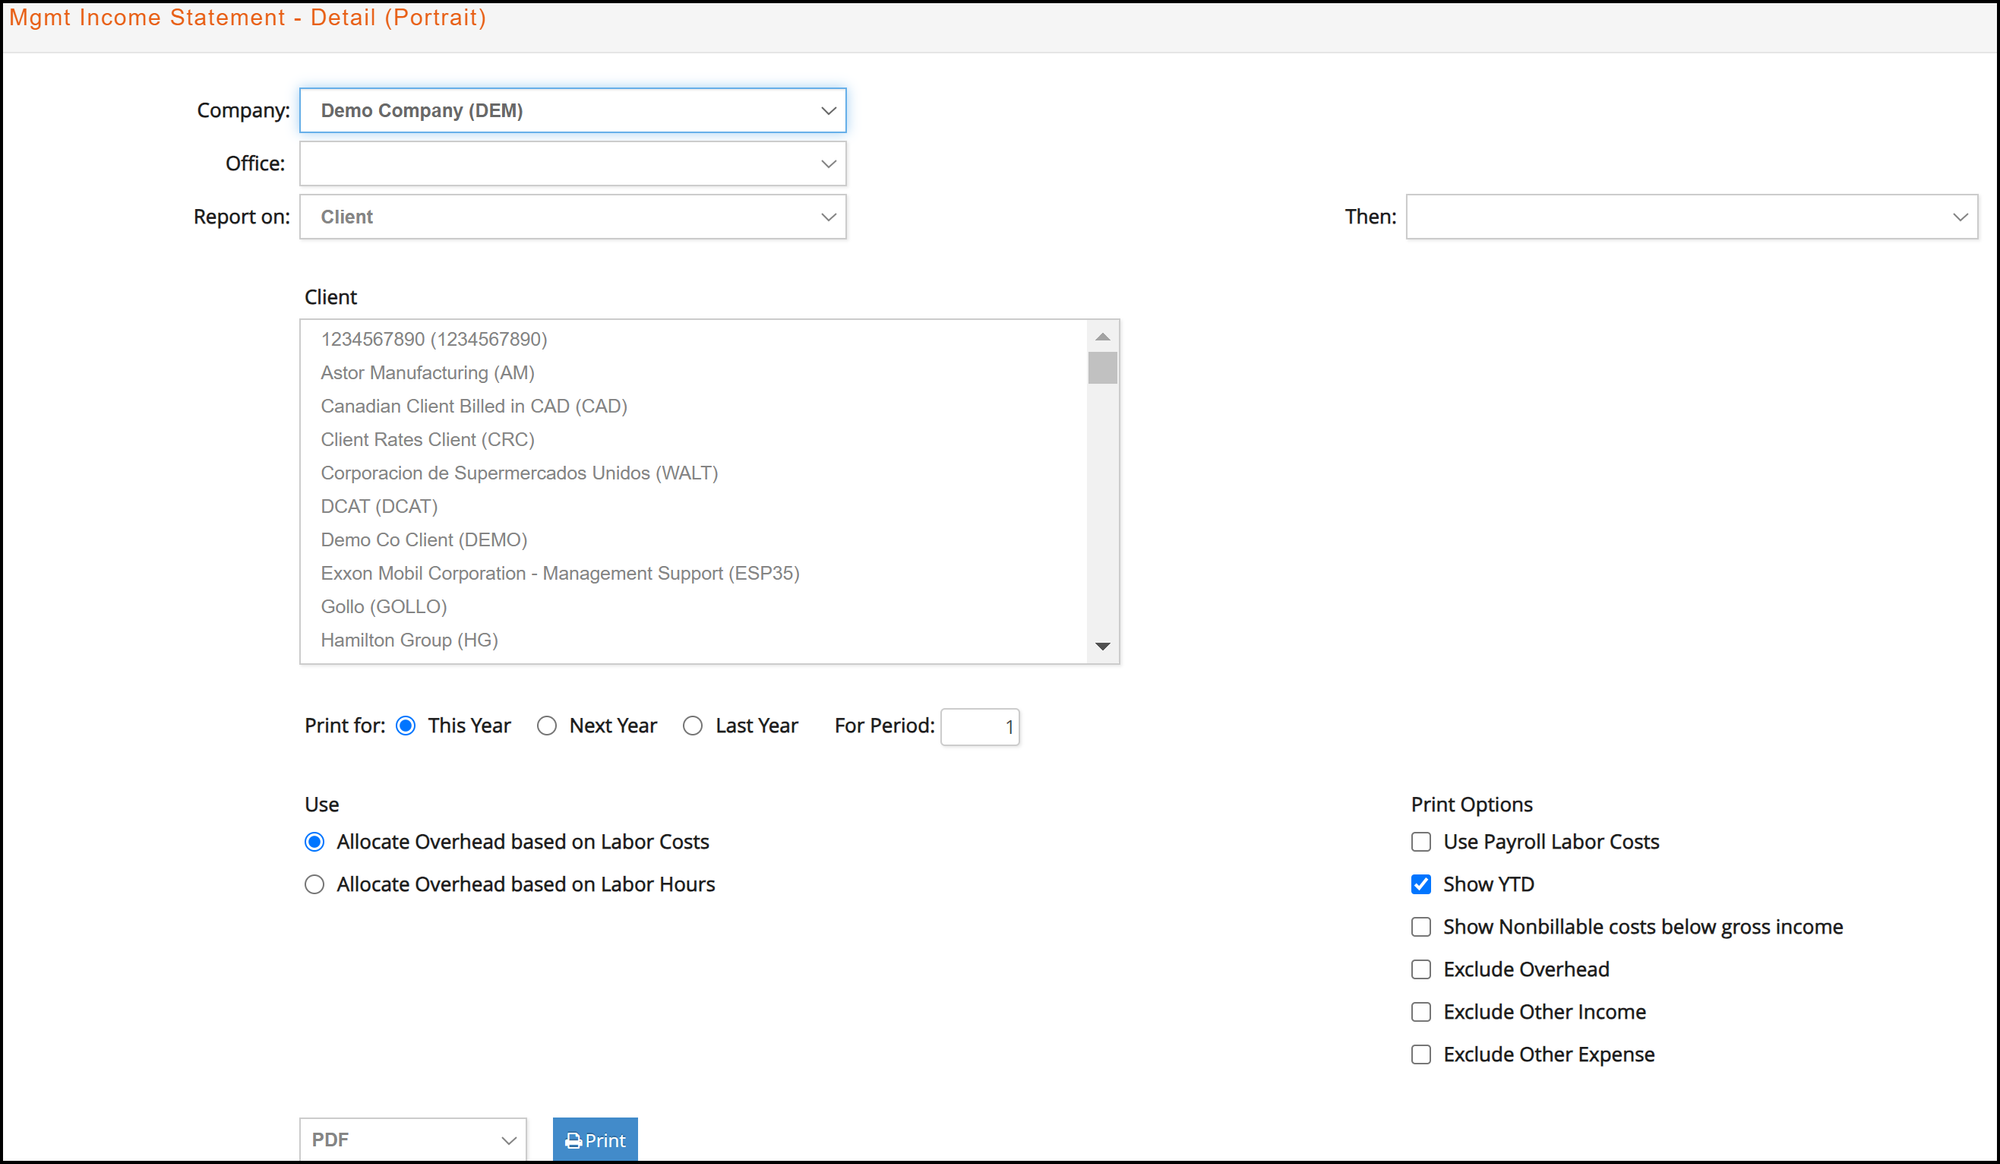

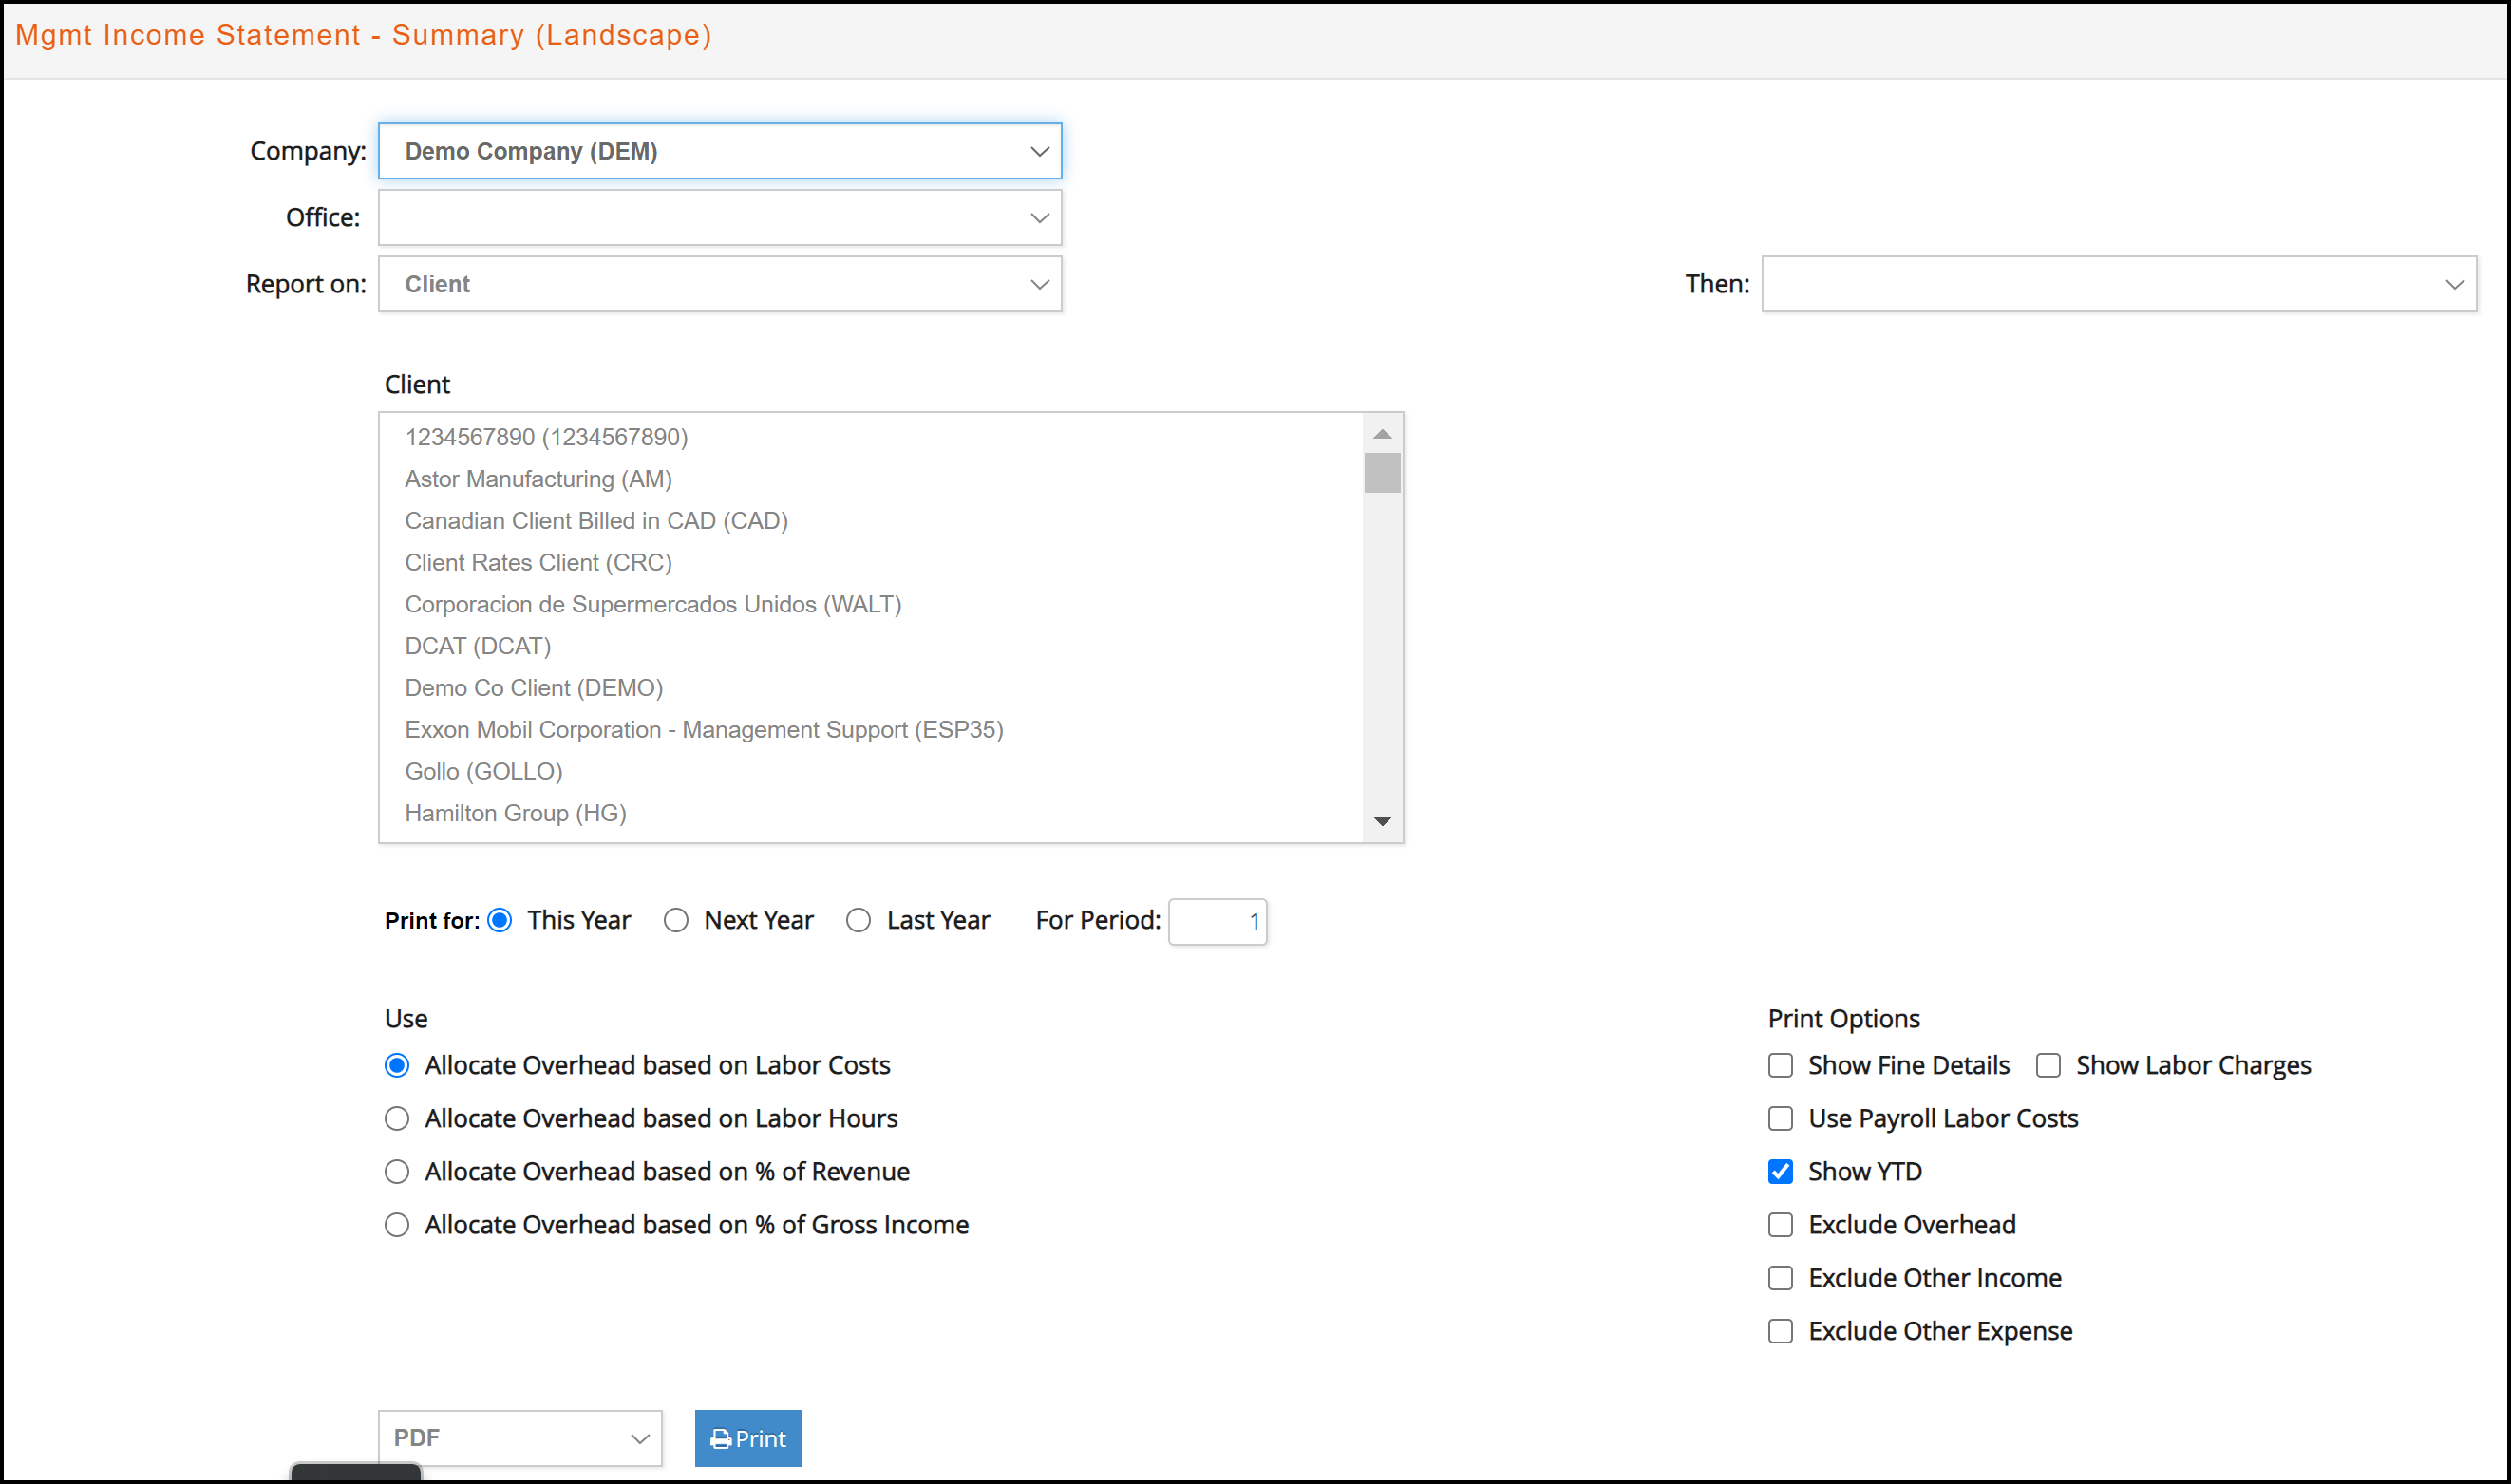
Summary (Landscape)
This reporting window prints the Mgmt Income Statements as a summarized P&L report for all 45 available formats. It includes current month and YTD column headers for Revenue, Net, Gross Income, Labor, Overhead and Net Income.
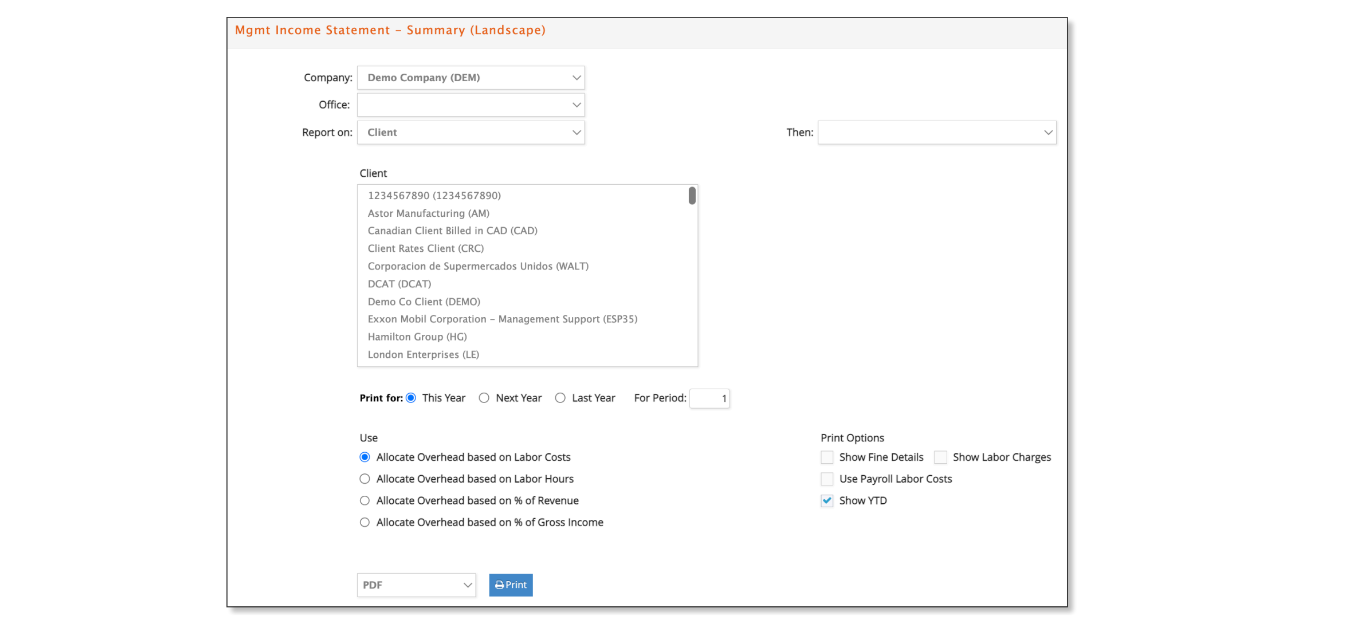

- Generate this report with the ‘Use the Show Fine Details’ but without the “Show YTD” options to show the detailed source transactions that are included in the amounts presented on the report. This is extremely helpful if you need to review the data to see which transactions make up a specific amount.
* This option is only available for a selected period excluding YTD to limit the amount of fine detailed data presented.
* Select to include time charges with the ‘Show Labor Charges’ option.
* For example, you print the Management Income Statement and you notice a $8,650 revenue amount for the East Coast Division of Astor Manufacturing. Generate the report again with Show fine Details and you’ll see this is from a media billing for magazine (MAG item).

For agency databases with multiple companies, an option is added to consolidate any of the Summary (Landscape) formats for two or more companies. When consolidating companies with different currencies, the posting currency for each company is shown with the ability to override the defaulted exchange rates. This report will automatically consolidate as the posting currency for the company selected at the top of the reporting selection window.
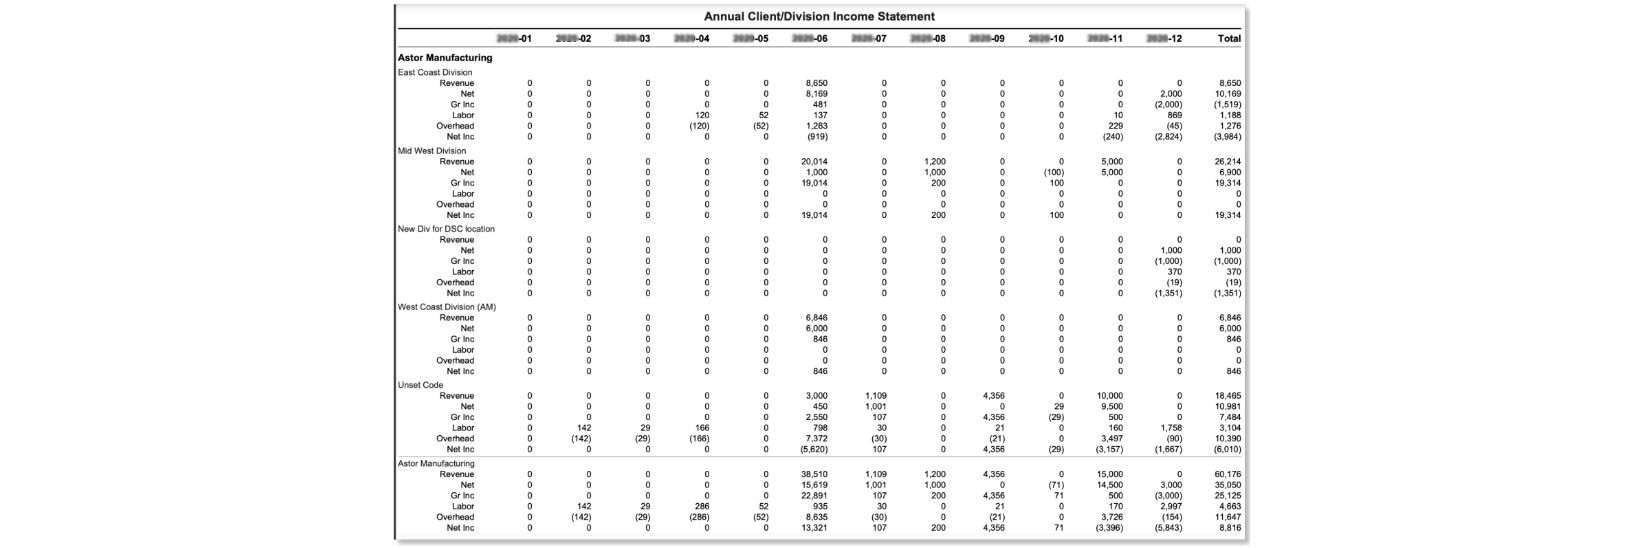
Annual Mgmt Review
This reporting window prints the Mgmt Income Statements as an annual P&L report with a month-to-month review for a majority of the 45 formats.
- Select to print for This Year, Next Year or Last Year.
- Generate it by client, office, team, AE, job type, job label 1, department or GL account with up to one additional ‘Then’ selection subtotal.

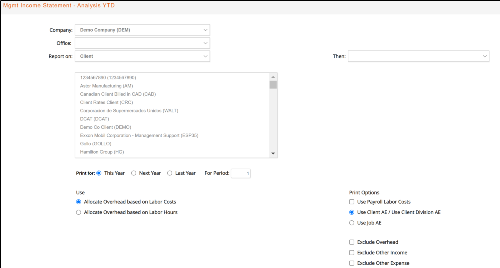
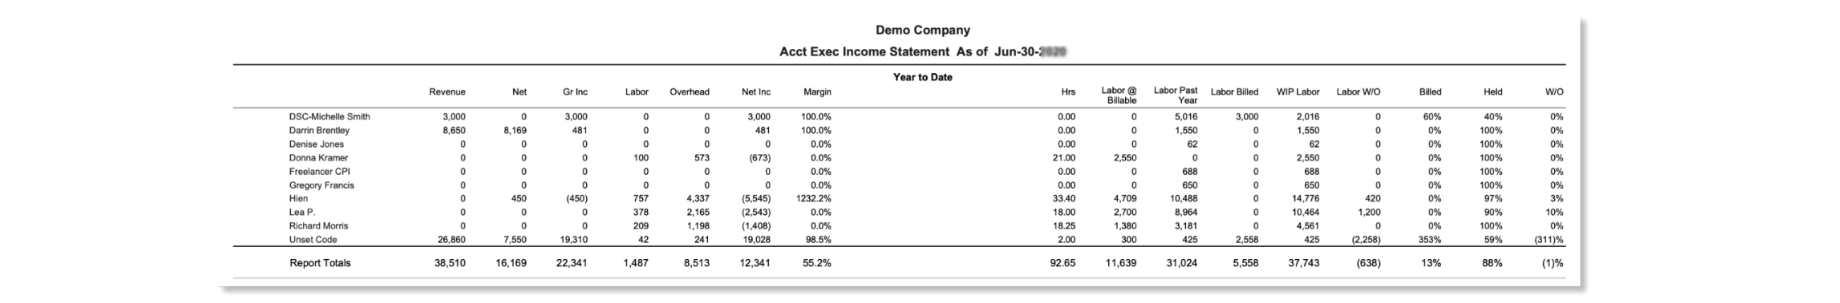
Analysis YTD
This reporting window prints the Mgmt Income Statements as a specialized report that reflects net income based on your selection by client, AE or client/division with a few additional subtotals by division, client or AE. It also includes extensive analysis of time and WIP charges based on specific criteria with options to specify from where to take the assigned AE.
Transaction Journal
The Transaction Journal is a list of each journal entry posted to the general ledger for a selected range of posting periods, transaction dates or journal entries. Print for a selected company, office, JE type, account type or GL account.

Tax
Within e·silentpartner, you have the capability to bill your clients and receive third party invoices reflecting a variety of regional sales taxes. This window gives you the ability to filter for your client invoices and/or vendor invoices and/or manual journal entries to ascertain what you were charged for sales tax compared to what you charged on your client invoices, or recorded manual tax transactions for.
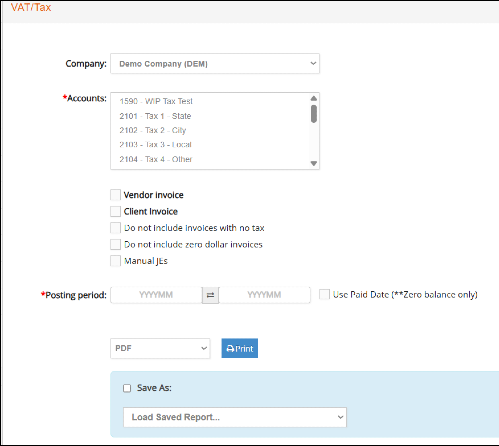
- Simply select the tax account on which you want to report and for what fiscal period(s).
- Select to report on either Vendor invoices, Client Invoices or both.
- Additionally, you can choose if you would like to not include invoices that have no tax, or have a zero dollar invoices.
- Enter a Posting Period or Posting Period range to be use when retrieving invoices. By default, Invoice date will be used, but you can generate the report based on Invoice Paid date
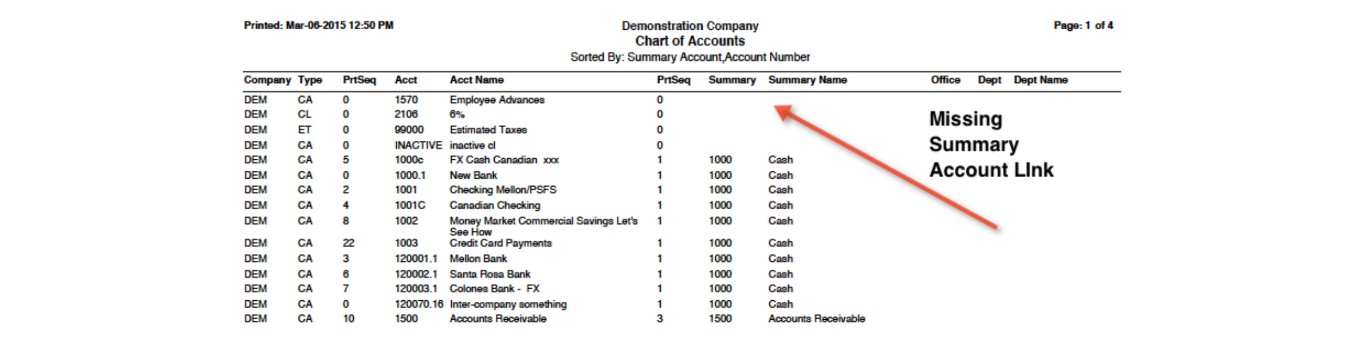
Chart of Accounts
This report gives you a listing of all accounts in the general ledger. Generally, the report is simply printed by account type followed by account number. But consider another option, such as, print by summary account to identify GL accounts that are not linked to a summary account.
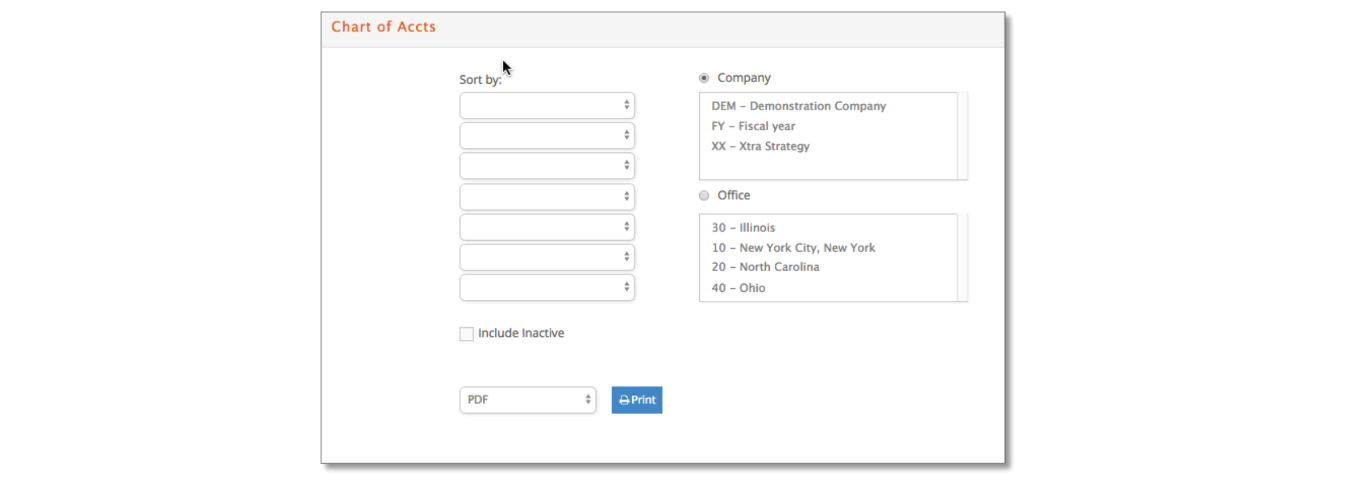
- Print for one or more by companies or offices.
- Optionally include inactive accounts.